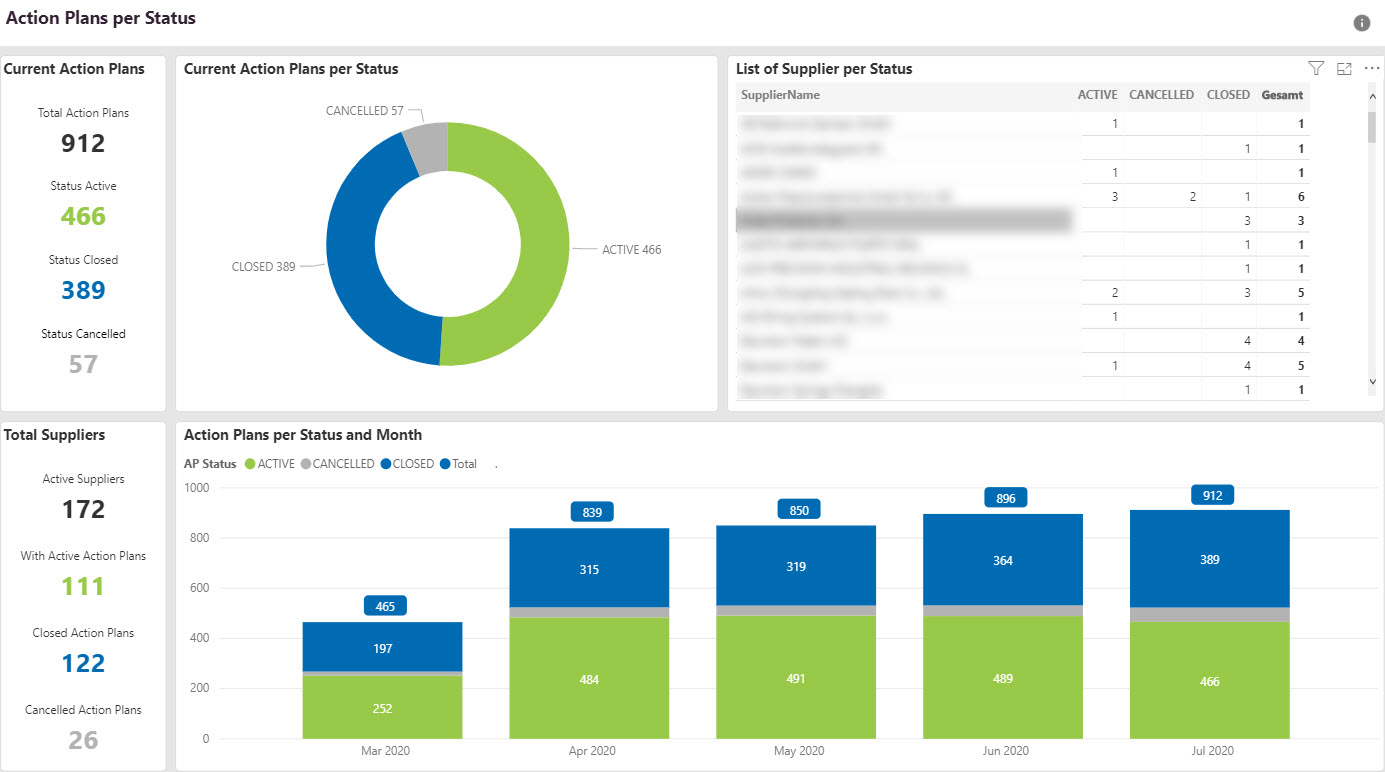
SupplyOn Action Management supports the creation and monitoring of action plans.
There are Filter in the filter section to limit the displayed action plans by:
- Creation Date
- AP Status (status of the action plans)
It is possible to click on elements of the charts to filter them or the other charts on the page.
On the upper left side of the status monitor you can find the numbers from the pie chart again displayed for a better overview.
On the lower left site of the status monitor you can find fields with generic information about your suppliers:
- Active Suppliers: How many suppliers use actively Action Management with their customer.
- With Active Action Plans: How many suppliers have at least one active action plan with their customer.
- Closed Action Plans: How many suppliers have at least one action plan with status closed with their customer.
- Cancelled Action Plans: How many suppliers have at least one action plan with status canceled with their customer.

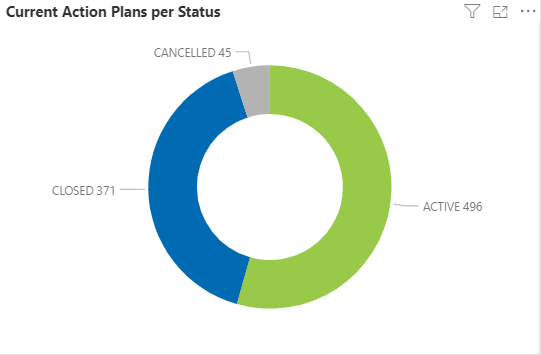
Current Action Plans per Status
Gives an overview over all existing action plans and their status.
You can get detailed information (e.g. Percentage, Numbers) by hoovering over specific category.

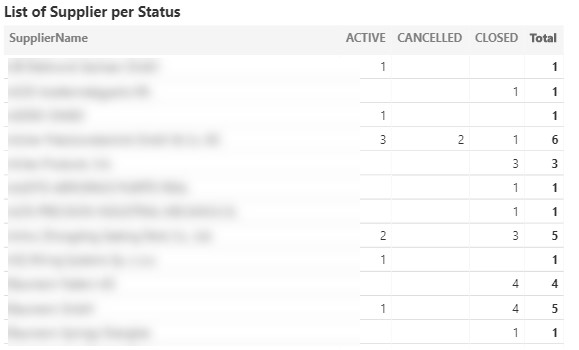
List of Supplier per Status
A list of suppliers with the number of their projects, grouped by their status.
Suppliers without any projects will not appear in this list.
Please note that it is also possible to download the list as xlsx, or csv. To do so, click on the three dots in the upper right corner of the KPI and press download.

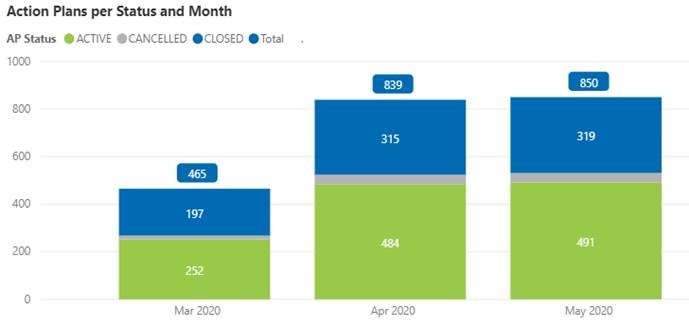
Action Plans per Status and Month
This stacked column chart is an overview of the development of action plans over the year accumulated on a monthly base.
Please note that the historical evaluation is currently not full filterable.
